top of page
Imposter Syndrome Realised
Search
James Goodall
Jun 15, 20233 min read
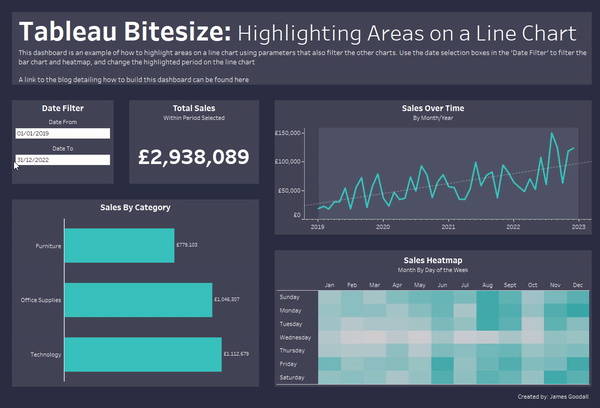
Tableau Bitesize: Highlighting Areas on a Line Chart
Every day you learn something new! And even though this one is pretty basic, I thought it was cool. This time – highlighting periods on a...
303 views0 comments
James Goodall
May 9, 20233 min read
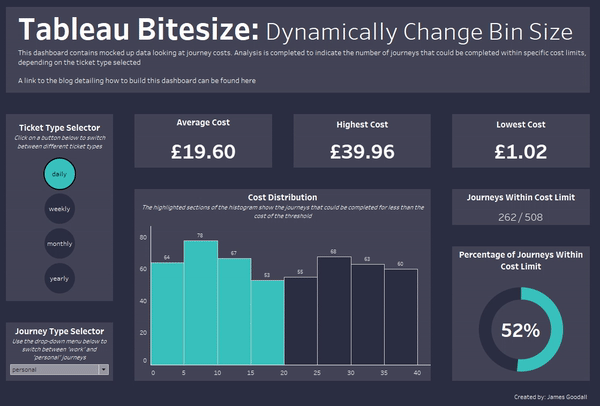
Tableau Bitesize: Dynamically Change Bin Sizes
Recently, I was completing some work analysing journey times and costs, and discovered that I needed to show the distribution of values...
270 views0 comments
James Goodall
Jan 20, 20233 min read
Tableau Bitesize: Passing Parameters Values in a URL
This may be old news to some people, but I’ve recently discovered that it’s possible to include parameter and filter values in a URL to a...
1,056 views0 comments
James Goodall
Dec 3, 20213 min read
Tableau Bitesize: Relative AND Custom Date Ranges
Consider this scenario – when your users open a dashboard, you want it to display a recent period, let’s say the latest 4 weeks. But at...
958 views0 comments
James Goodall
Jan 8, 20212 min read
Tableau Bitesize: Progress To Target
This is a quick summary post just to group together a number of other posts I have published recently. Rather than a single bitesize blog...
1,628 views1 comment
James Goodall
Jan 8, 20212 min read
Tableau Bitesize: Progress To Target - Filled Shape Chart
This bitesize post details how to create a filled shape chart This is cheating a little bit, because to think of the name, you’d expect...
378 views0 comments
James Goodall
Jan 8, 20212 min read
Tableau Bitesize: Progress To Target - Bullet Chart
This post details how to create a bullet chart from scratch The Tableau experts among you may be aware that the bullet chart is actually...
340 views0 comments
James Goodall
Jan 8, 20213 min read
Tableau Bitesize: Progress To Target - Gauge Chart
This gauge chart is the type people most commonly think of when they hear the words gauge chart, but it’s not quite as straight forward...
821 views0 comments
James Goodall
Jan 8, 20212 min read
Tableau Bitesize: Progress To Target - Needle Gauge Chart
This post will go through the process of creating what I’ll call a ‘Needle Gauge’ chart (simply to differentiate it from the typical...
2,010 views0 comments
James Goodall
Jan 8, 20212 min read
Tableau Bitesize: Progress To Target - Plum Pudding Chart
This post will detail how to make a circular waffle (or plum pudding) chart, and is only possible thanks to this blog post by Kizley...
815 views0 comments
James Goodall
Jan 8, 20212 min read
Tableau Bitesize: Progress To Target - Waffle Chart
This chart type was only made possible for me by the one and only Andy Kriebel in this video and this post will basically follow the same...
316 views0 comments
James Goodall
Jan 8, 20212 min read
Tableau Bitesize: Progress To Target - Rounded Progress Bar
This chart is very similar to the progress bar chart type, but looks a little neater (in my opinion anyway), and only requires a little...
2,421 views0 comments
James Goodall
Jan 8, 20212 min read
Tableau Bitesize: Progress To Target - Progress Bar Chart
This post will detail how to create a progress bar chart that shows progress towards a 100% goal Essentially this is a 100% stacked bar...
490 views0 comments
James Goodall
Jan 8, 20212 min read
Tableau Bitesize: Progress To Target - Slider
This post will detail how to create a slider chart that shows progress towards a 100% goal. I have previous written a post that goes...
392 views0 comments
James Goodall
Jan 8, 20212 min read
Tableau Bitesize: Progress To Target - Donut Chart
This post will go through the process of creating a donut chart in Tableau Actually – to call it a donut chart is a little misleading –...
1,217 views0 comments
James Goodall
Dec 11, 20202 min read
Tableau Bitesize: Diamond Heatmap with LOD Ranks
This blog post will go through the process of how to create a diamond shaped heatmap, using LODs to calculate rankings If you read my...
244 views0 comments
James Goodall
Dec 3, 20208 min read
#IronQuest: Black & White
After telling myself I’d be entering #IronQuest on multiple occasions and failing in all my attempts to do so, I decided that this month...
186 views0 comments
James Goodall
Nov 27, 20202 min read
Tableau Bitesize: Rounded Bar Charts with Gradient Fill
It's been a little while since I last posted a blog; with so much going on both in my personal and professional life I've let this slip a...
949 views3 comments
James Goodall
Oct 2, 20203 min read
Tableau Bitesize: Buffer Calculations
This blog post will detail the process of using buffer calculations, a new piece of functionality that was introduced in Tableau 2020.1,...
992 views0 comments
James Goodall
Sep 11, 20204 min read
#MakeoverMonday Week 21: How To
Well this one is going back a while, but I thought it might be interesting to re-visit an old viz I created for #MakeoverMonday week 21...
45 views0 comments
Home: Contact
bottom of page